Mynda Treacy – Excel Dashboards Course
$62.00$399.00 (-84%)
An index of the course topics and terminology that are covered so you can easily find a tutorial you want to watch again.
Mynda Treacy – Excel Dashboards Course
Check it out: Mynda Treacy – Excel Dashboards Course
It doesn’t have to be that way.
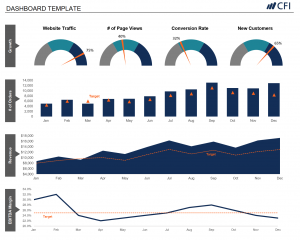
In my Excel Dashboard course I teach you how to create amazing interactive Excel dashboards, like the ones below, that update with the click of the Refresh button, or with a simple copy and paste of your new data into your spreadsheet. They’ll wow your boss and take your career to the next level.
So, what is an Excel Dashboard?
An Excel Dashboard provides insight, analysis and alerts. They’re fully interactive and dynamic and can help with project management, customer service, retail management, financial forecasting and much more.
Key features:
- Usually fits on one page
- Displays key trends, comparisons and data graphically or in small tables
- Provides the reader with conclusions to their objective
- Is often interactive allowing the user to filter data and switch views themselves
- Employs best practices that enable the report to be updated quickly and easily (often at the click of just one button)
What the Excel Dashboard Course Will Do For You
This comprehensive Excel Dashboard Course will teach you the simple techniques you can apply in Excel to make killer dashboards that will set your skill level apart from the crowd.
I teach you how to build Excel Dashboard reports from the ground up.
By applying the simple rules I share with you, you will have the skills to be able to create reports that save loads of time (allowing you to go home early :)) and you’ll quickly become known as a Dashboard Superhero with reports that are:
-
- Quick and easy to update, in fact they can update themselves (imagine being able to confidently say that in an interview) by pulling in data direct from your external database, Microsoft Access, the web etc. at the click of a button if you set them up right (I show you how).
-
- Fully interactive so the reader can change the view themselves; they can filter by product, time period or any parameter you choose, they can show and hide data using check boxes, drop down lists, and option buttons to name a few.
-
- Easy to read and interpret; plus I share with you a heat map of your page that shows you where your most important data should go and where will get the least attention.
-
- Exactly what the reader wants; I teach you the 5 key questions to ask and to who in the planning stage of your report so you get it right first time.
-
- Choose the right chart for your data; I teach you over 20 charts and show you which type of chart will best display your data.
Just take a look at the two charts below. Both plot the same data but one is much easier to make comparisons in the data than the other. You be the judge.
-
- Professional presentation. I teach you simple visualisation techniques so your reports will look like you’ve had a graphic designer involved even if you are completely lacking in artistic talent (like me).
-
- Animated. Some types of data are great displayed in an animation. Animated charts allow the reader to get an understanding of how data moves over time. In this course I share some VBA code with you that you can apply to your charts and I show you exactly which parts of the VBA to edit.
Watch the Course Overview Video
Or if you prefer, continue reading for more information on the course.
| For best viewing quality: press play then 1. click the cog and select 720p HD, and 2. click the icon on the bottom right of the video to view in full screen. |
What You Get in the Course
-
- Over 9 hours of video tutorials specifically on Dashboards plus another 3 hours of (optional) related Excel training that will fill in any gaps in your Excel knowledge on topics like PivotTables, Lookup Functions, Macros and more.
-
- The pace is pretty fast because I hate courses that waffle on. I like to get straight to the point so you’re up to speed fast, and I’ve designed it so that if you need to re-watch anything you can rewind and replay the videos as many times as you like, or just refer to the instructions in the workbooks.
-
- You can download the actual Excel files used in the filming.These files contain step by step instructions so you can either use them on their own instead of the videos (these are great if you like to skim read like I do), use them to practice what you learn and build your confidence, or keep them forever as a reference tool that you can go back to later on to refresh your memory (let’s be honest, we never remember everything the first time we see it).
- 5 x sample Excel dashboard reports including my popular Tour de France dashboard. Use them to steal ideas from and reverse engineer.
-
- Homework Challenge. Practice what you learn so that you don’t forget it. Plus you’ll be creating a dashboard of your own that you could use for job interviews to showcase your skills. If you like you can even send it to me and I’ll review it and give you feedback.
-
- An index of the course topics and terminology that are covered so you can easily find a tutorial you want to watch again.
-
- 6 weeks of support from me. We have a dedicated support forum for Dashboard course members where you can post a question and I’ll post you an answer. These Q&A’s will be available for everyone in the class to learn from too (you can even post the answer to your classmate’s questions if you know it), making it a truly interactive class. Or, if you prefer you can email me your questions direct.Note: The reason the course is only open for a limited time is because I am personally providing the initial 6 weeks of support, and I can’t commit to doing that year round. So, I limit the classes to allow time for other projects and a break every now and again.
- That’s not to say I won’t support you after the first 6 weeks (after all you have a 12 month membership), it’s just that it might take me a few days to reply if I’m out of town etc.Support of my members is one of the benefits and it’s very important to me and is valuable to my members, as you can see from this email from Arash:
“I feel like I have a 24hr support. The way you reply and support, in terms of time and effectiveness is not comparable to other websites and people who provide learning modules. You are Superb!!!”
- The training is delivered online and tutorials are available to watch 24/7 at your own pace. Pause, rewind, replay as many times as you like.
-
- 12 months access to the video tutorials and file downloads. There’s even a download option where you can download all videos in the course and keep them on your own PC forever.
- When you’ve finished I’ll send you a ‘Certificate of Completion’ saying you’ve completed the course which you can add to your résumé/CV arsenal.